
An exposure score describes tasks
An occupation contains several tasks. AI can assist a task without removing the occupation. An estimate of job losses also needs evidence about adoption, changes to work, transfers to other roles and new positions.
JLM provides two separate tools: an occupation-data viewer and a workforce scenario calculator. The viewer uses the ILO’s published 2025 exposure scores. The calculator uses adjustable assumptions. It does not assign a probability to a scenario. [ilo25]
Occupation counts are not worker counts
The source workbook covers 427 occupation groups. After repeated occupation records are removed, the median exposure score is 0.27. Each group has equal weight in this median. Data Entry Clerks score 0.70. Neither value is the percentage of people expected to lose employment. [ilo-data]
Thirteen groups are in the highest exposure category. National employment data are needed to establish how many workers have those occupations. Counting each occupation once does not count each worker equally.
The ILO authors describe “transformation of jobs” as the most likely impact in their 2025 summary. This still leaves questions about wages, entry-level work, workload and new tasks. [ilo25]
A scenario depends on its assumptions
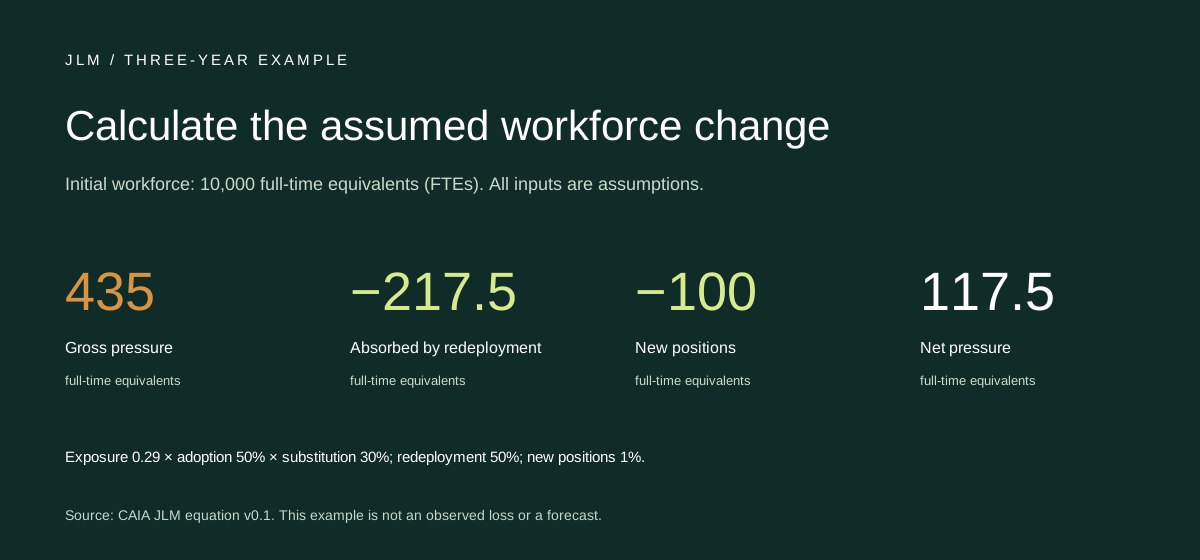
Consider a fictional workforce of 10,000 full-time equivalents over three years. One full-time equivalent, or FTE, represents the work assigned to one full-time position.
The model treats exposure of 0.29 as 29% of work capacity. This conversion needs local validation. Adoption of 50% means that AI is used for half of the exposed work. Substitution of 30% means that 30% of that adopted capacity replaces labour.
These assumptions give 435 FTEs of gross employment pressure. This is the reduction in required work before redeployment and new positions. Redeployment means that other paid roles absorb released work capacity.
Assume that redeployment absorbs half of the pressure and that 100 new FTE positions become available. Net pressure is then 117.5 FTEs, or 1.175% of the initial workforce. Each model input is an assumption.
The result measures work capacity, not a fraction of a person. The 3D chart shows how the result changes with adoption and substitution. Its height is calculated pressure. The animation does not show a probability or a forecast for each year.
Measure the use of released work capacity
When task time decreases, workers can handle more cases, improve quality, reduce queues, change roles or leave. A workforce study must record what occurs. Training attendance alone does not establish redeployment. Evidence of a defined paid role is needed.
Acemoglu and Restrepo separate displacement from productivity and new tasks. JLM uses that distinction in a simple equation. A national estimate needs more evidence about employment, demand, trade and worker transfers. [automation]
Before you use a forecast, identify its adoption rate, substitution assumption, redeployment evidence and expected new positions. If these inputs are missing, the forecast does not explain how it reaches its result.