Track export demand alongside adoption
Monitor global-services renewals, client concentration and paid work. Faster delivery cannot compensate for contracts that no longer exist.
Caribbean AI Association research
Explore the work people do, the services Jamaica sells and the conditions that could change both.
Wider adoption with slower worker adjustment.
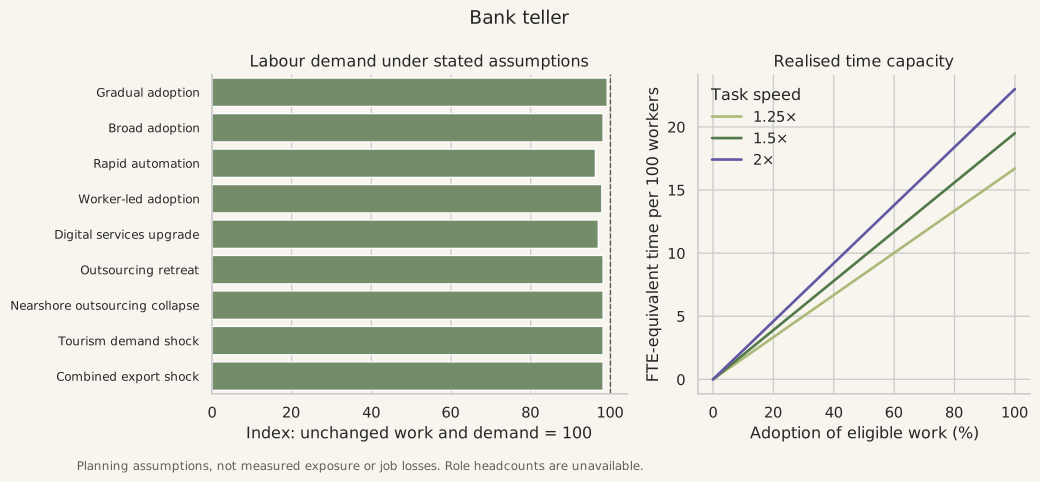
Routine records, reconciliations and service messages can change; cash handling, identity exceptions and vulnerable-customer support still require people.
Recommended action. Track transaction errors, unresolved exceptions, branch access and customer outcomes. Do not treat digital channels or ATMs as effects of generative AI alone.
Time shares and demand responses are planning assumptions, not measured exposure. The O*NET occupation and task source describes US work. Local time weights and an occupation-by-industry headcount are unavailable.
The assumed direct demand loss for this role in the selected case is 0.0%. Labour demand is indexed as 100 × (1 − direct demand loss) × productivity^(elasticity − 1), assuming full productivity-related cost pass-through. Indirect credit, supplier and income effects are not estimated.
Realised capacity = max(0, 70% × adoption × [automation share + augmentation share × (1 − 1/speed)] − 5% × adoption). The calculator updates this formula only. It does not change the stored scenario comparison or the national economic model.
Each occupation combines physical work, information, judgement and responsibility.
Selected task examples, with provisional rule-based labels. Displayed task counts do not determine the assumed time shares. Professional approval and physical delivery are not delegated by this illustration.
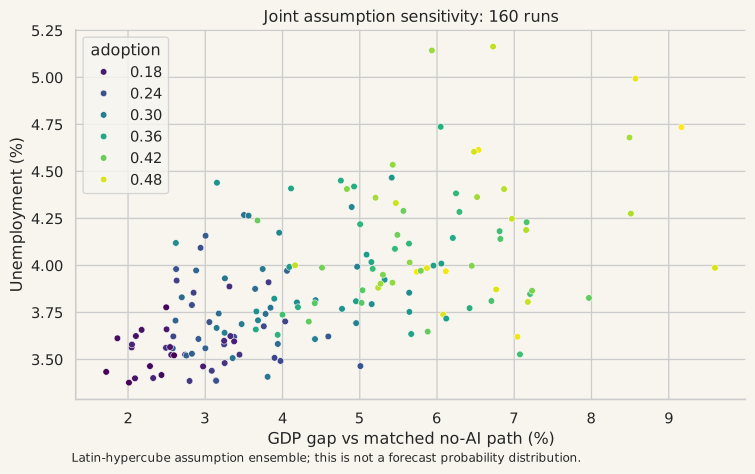
Core outcomes use a matched no-AI comparison. GDP gaps are differences in output levels, not annual growth. Wage groups are model categories, not forecasts for the selected occupation.
Core adoption by 2030 is 30%, autonomy is 75%, and the new-task parameter is 0.25. The assumed cognitive employment allocation is 38.4%. Adoption is a share of affected task instances, not all jobs.
Demand cases impose output weights of 3% for outsourced services and 8% for direct tourism. These are stress assumptions, not observed Jamaican GDP shares. There is no current input-output multiplier. The music shock affects the role calculation only; no music GDP share is invented. The full report specifies the equations, paired comparisons, fixed labour force and omitted feedbacks.
| Scenario | Type | GDP gap | Unemployment |
|---|---|---|---|
| Gradual adoption | Core economic model | +0.71% | 3.40% |
| Broad adoption | Core economic model | +3.61% | 3.76% |
| Rapid automation | Core economic model | +13.50% | 8.07% |
| Worker-led adoption | Core economic model | +2.56% | 3.60% |
| Digital services upgrade | Core economic model | +4.94% | 3.81% |
| Outsourcing retreat | Demand stress test | +2.06% | Not estimated |
| Nearshore outsourcing collapse | Demand stress test | +0.50% | Not estimated |
| Tourism demand shock | Demand stress test | +1.54% | Not estimated |
| Combined export shock | Demand stress test | -0.79% | Not estimated |
STATIN reported 1,419,200 people employed in July 2026, with unemployment at 3.4% and informal employment at 56.2%. Employment shares describe workforce scale; they do not measure an industry’s GDP contribution or AI exposure. Source ↗
| Industry | People employed | Share |
|---|---|---|
| Wholesale and Retail Trade; Repair of Motor Vehicles and Motorcycles | 268,700 | 18.9% |
| Agriculture, Forestry and Fishing | 182,200 | 12.8% |
| Construction | 152,200 | 10.7% |
| Real Estate and Other Business Services | 146,800 | 10.3% |
| Education, Human Health and Social Work Activities | 127,300 | 9.0% |
| Accommodation and Food Service Activities | 125,500 | 8.8% |
| Arts, Entertainment, Recreation and Other Services | 117,100 | 8.3% |
| Manufacturing | 87,100 | 6.1% |
| Public Administration and Defence; Compulsory Social Security | 73,800 | 5.2% |
| Transportation and storage | 70,700 | 5.0% |
| Financial and Insurance Activities | 36,100 | 2.5% |
| Information and Communication | 12,500 | 0.9% |
| Electricity, Gas and Water Supply | 10,400 | 0.7% |
| Combined suppressed / unallocated residual | 8,800 | 0.6% |
| Total | 1,419,200 | 100.0% |
The combined 8,800-person residual preserves suppressed categories, unallocated employment and rounding. It is not a mining count. Occupation headcounts cannot be recovered from these industry totals.
These are conditional scenarios. Adoption, task times and movement between jobs depend on assumptions; they have not been measured locally for this study. Industry demand stresses use assumed value-added weights and do not estimate national unemployment.
Monitor global-services renewals, client concentration and paid work. Faster delivery cannot compensate for contracts that no longer exist.
Measure accuracy, verification costs, fees and working time. Separate routine processing from professional judgement and approval.
Review reservations, guest service and staffing together. Do not attribute changes caused by demand or recovery to AI alone.
Separate live performance, recordings, publishing and licensing. Track consent, ownership and attribution as well as production costs.
Include informal workers and measure placement, earnings and retention. Training completion alone does not show that people found better work.
SOURCES
Caribbean AI Association, version 2.0. Sources retrieved 20 October 2026. The full report records each source’s use and access scope.
Working Paper 2026-02; Sections 2–3 and Appendix A; task-based economic framework
Public task illustration and scenario explorer
Main Indicators; EMP by Industry; EMP by Occupation; EMP by Formality; INFOR_FOR EMP by Industry; EMP by ISCED. July 2026, history to January 2024
Historical cross-check; download ends July 2025, not current baseline
2008 SNA and JIC 2016; disaggregated historical IO table available at cost
2023 GDP compensation taxes subsidies mixed income; JMD million; published via STATIN Annual GDP page
Historical structure only; not used as current 2026 multipliers
Task statements and occupation CSV; 21 representative US occupations; database CC BY 4.0
Gmyrek et al.; DOI 10.54394/HETP0387; exposure versus displacement; need local microdata
Task-based occupations; major groups and need for detailed crosswalk
Executive summary and contents; infrastructure skills firms and trust
16 January 2026; recovery and external financing context, not AI impact
6 March 2026; more than 50000 global digital services workers reported; policy view is not causal evidence
MIT-licensed implementation of the task-based economic framework
DOI 10.3386/w32487; aggregation of task savings
DOI 10.3386/w25684; displacement and reinstatement
DOI 10.3386/w31161; setting-specific workplace productivity evidence; no effect size transferred
Creative income, licensing and synthetic content competition; global projections are not transferred to Jamaica
External-sector data acquisition route; no BPO-only or current sector value-added share obtained
O*NET® 31.0 Database, US Department of Labor / Employment and Training Administration, used under CC BY 4.0. Task classifications, weights and new-work examples are CAIA adaptations. No USDOL/ETA or Anthropic endorsement is implied. Econ-ARK model attribution and its MIT licence are retained in the research package.